

City market snapshot · Dallas County · September 2026
Sunnyvale housing market, September 2026.
Realtor.com's figures for Sunnyvale, Texas in September 2026: list prices, price per square foot, homes for sale, days on market, price reductions and pending sales, each against a year earlier.
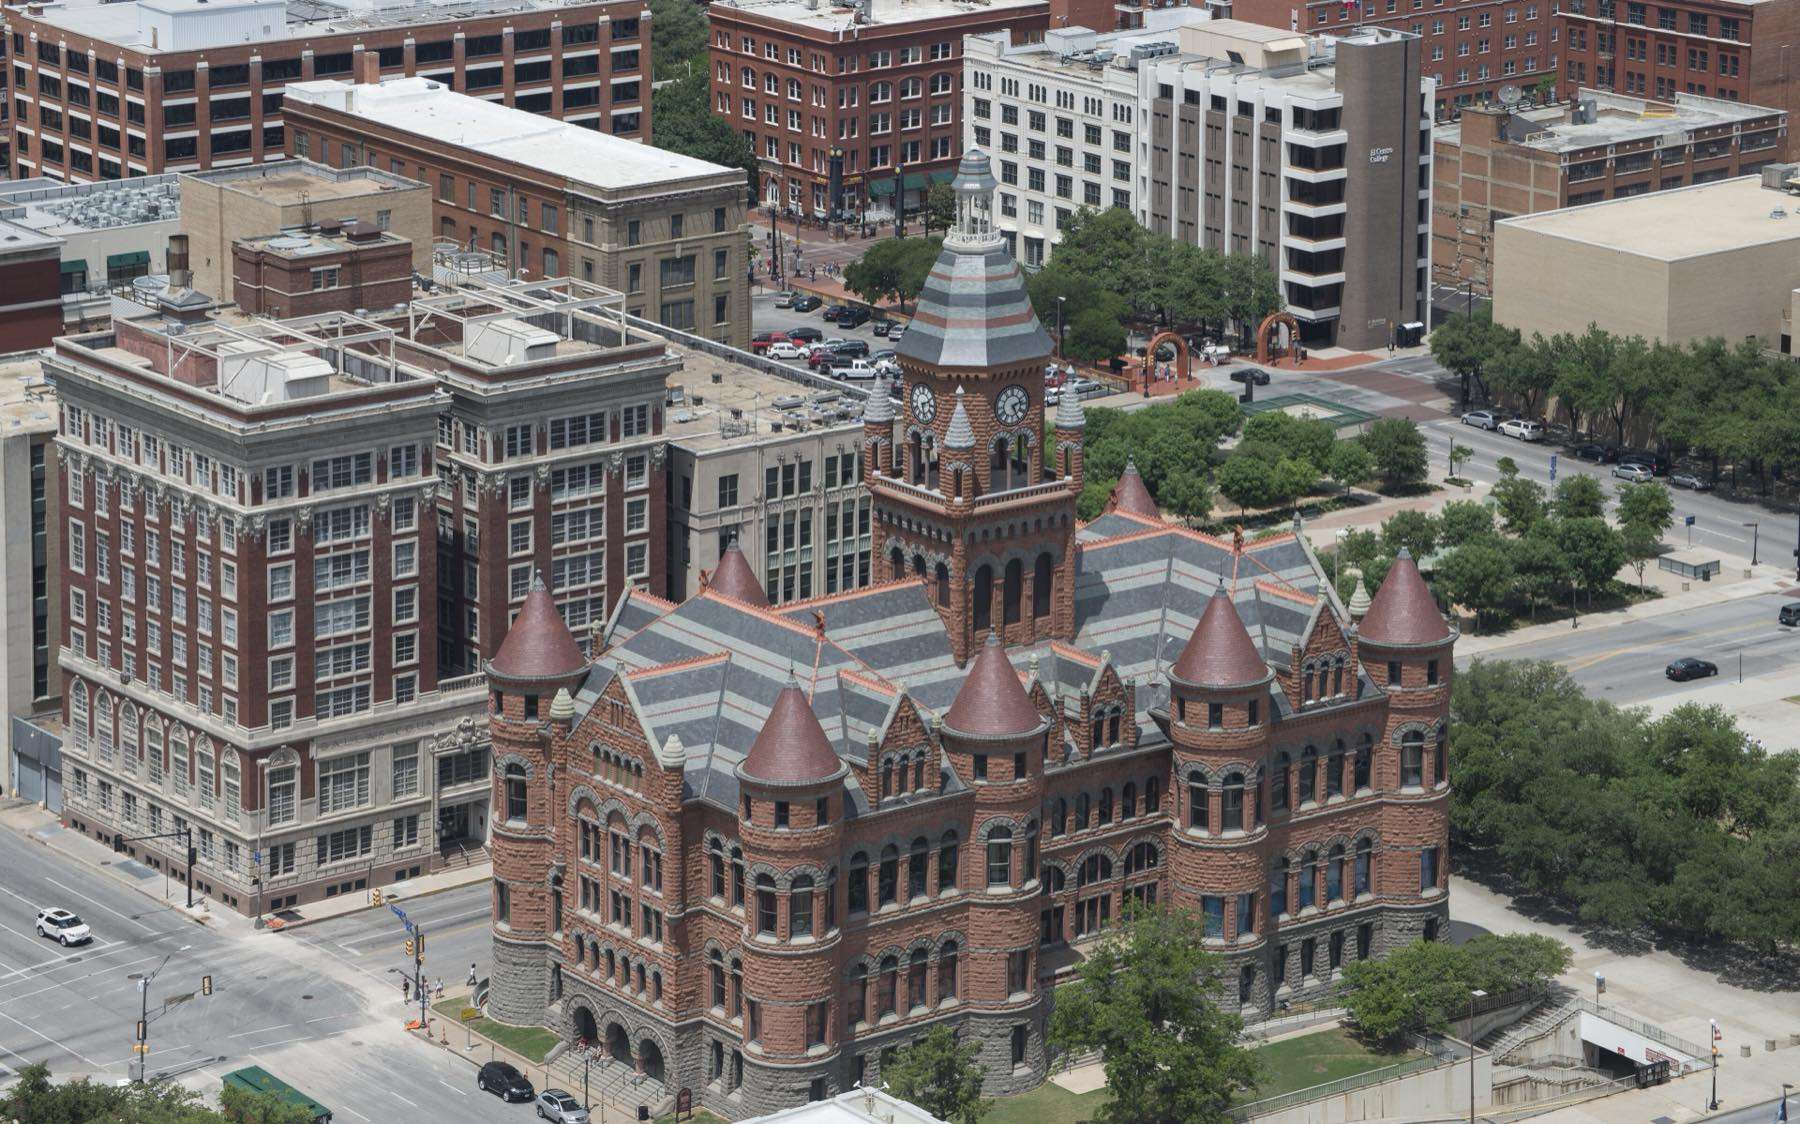
Photo: Carol M. Highsmith, Public domain, via Wikimedia Commons
Sunnyvale · September 2026
- Median list price
- $780,000
- ▲ 4.0% vs. a year ago
- Homes for sale
- 35
- ▼ 7.9% vs. a year ago
- Median days on market
- 58
- ▼ 43 days vs. a year ago
- Median list price per sq ft
- $207
- ▼ 3.7% vs. a year ago
- With a price reduction
- 40%
- 32% a year ago
- Pending listings
- 7
- ▼ 30.0% vs. a year ago
Source: Realtor.com data by ZIP code, September 2026. Realtor.com counts the homes listed on its site in the ZIP code it assigns to Sunnyvale. These are listing figures, not closed sales. ZIP codes: 75182.
Where the market leans
Leans toward buyers
| Measure | This month | Votes sellers | Votes buyers | Vote |
|---|---|---|---|---|
| Pending ÷ active listings | 0.20 | ≥ 0.75 | ≤ 0.30 | Buyers |
| Median days on market | 58 | ≤ 40 | ≥ 60 | Neither |
| Price-reduced ÷ active listings | 40% | ≤ 30% | ≥ 40% | Buyers |
| Active listings vs. a year earlier | −7.9% | ≤ −10% | ≥ +10% | Neither |
How we read this: each of the four measures votes for buyers or sellers when it passes the threshold shown. A side needs at least two more votes than the other. If neither side has more than one vote, the market is balanced. Any other split, or a missing figure, gets no label. It is the same rule our weekly market posts use.
What the numbers say
Sunnyvale in September 2026
The median list price in Sunnyvale was $780,000 in September 2026, 4.0% higher than in September 2025 ($749,675). There were 35 active listings, 7.9% fewer than a year earlier (38), and the median days on market was 58, 43 days fewer than a year earlier. Pending listings numbered 7, and 40% of active listings had a price reduction during the month (32% a year earlier).
Our listings and sales in Sunnyvale
Search every DFW listing →